> ## Documentation Index
> Fetch the complete documentation index at: https://docs.frayme.io/llms.txt
> Use this file to discover all available pages before exploring further.
# Dashboard
> Read the four panels, understand the period selector, and know which tiles are placeholders.
export const Shot = ({id, alt, caption}) =>

 ;
The Dashboard at [`/`](https://console.us.frayme.io/) is the first page after sign-in.
## Layout
Four panels below a row of metric tiles:
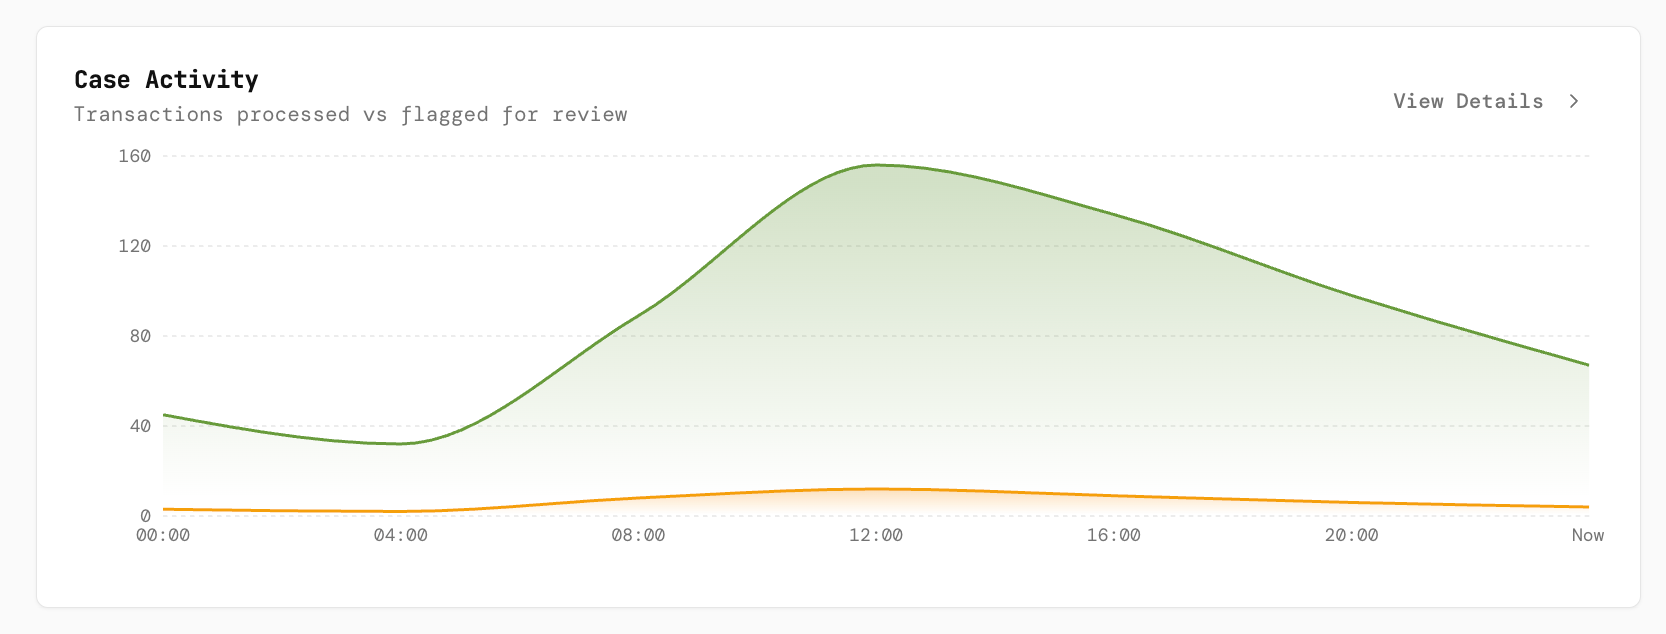
* **Case Activity** — cases processed over the selected period.
* **Risk Distribution** — today's cases by risk level, with counts and a share bar.
* **Pending Queue** — the cases awaiting review, with a **View All** link to the Decision Queue.
* **Data Sources** — the health of the connected providers.
## Case Activity and the period selector
**Today**, **7 Days** and **30 Days** change the Case Activity chart only. The other three panels always show current data.
;
The Dashboard at [`/`](https://console.us.frayme.io/) is the first page after sign-in.
## Layout
Four panels below a row of metric tiles:
* **Case Activity** — cases processed over the selected period.
* **Risk Distribution** — today's cases by risk level, with counts and a share bar.
* **Pending Queue** — the cases awaiting review, with a **View All** link to the Decision Queue.
* **Data Sources** — the health of the connected providers.
## Case Activity and the period selector
**Today**, **7 Days** and **30 Days** change the Case Activity chart only. The other three panels always show current data.
 ## Pending Queue and View All
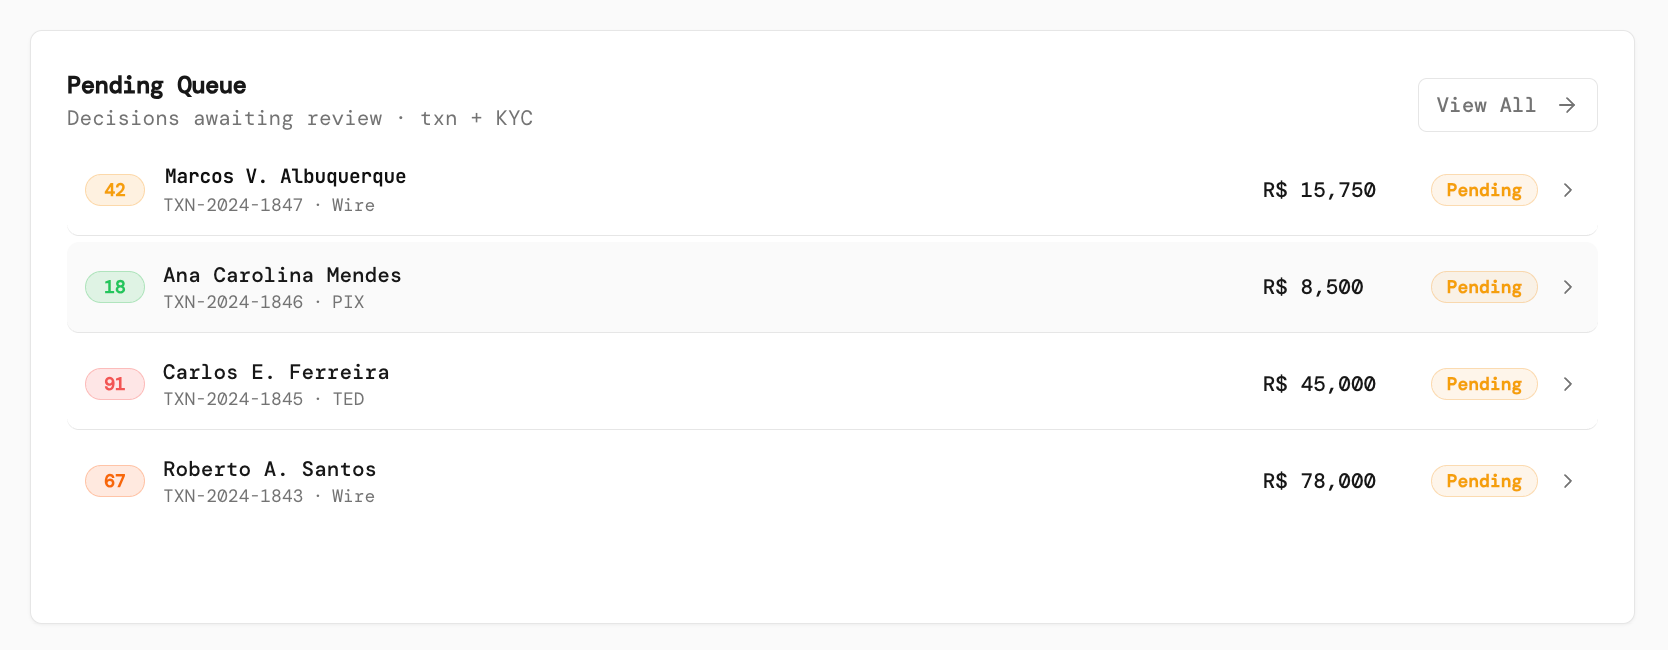
The panel lists a handful of waiting cases with their risk badge, customer, case id, type, amount and status. **View All** opens the [Decision Queue](/guides/analyst/decision-queue). Clicking a row opens the Decision Console on the first queued case.
## Pending Queue and View All
The panel lists a handful of waiting cases with their risk badge, customer, case id, type, amount and status. **View All** opens the [Decision Queue](/guides/analyst/decision-queue). Clicking a row opens the Decision Console on the first queued case.
 ## Data Sources health
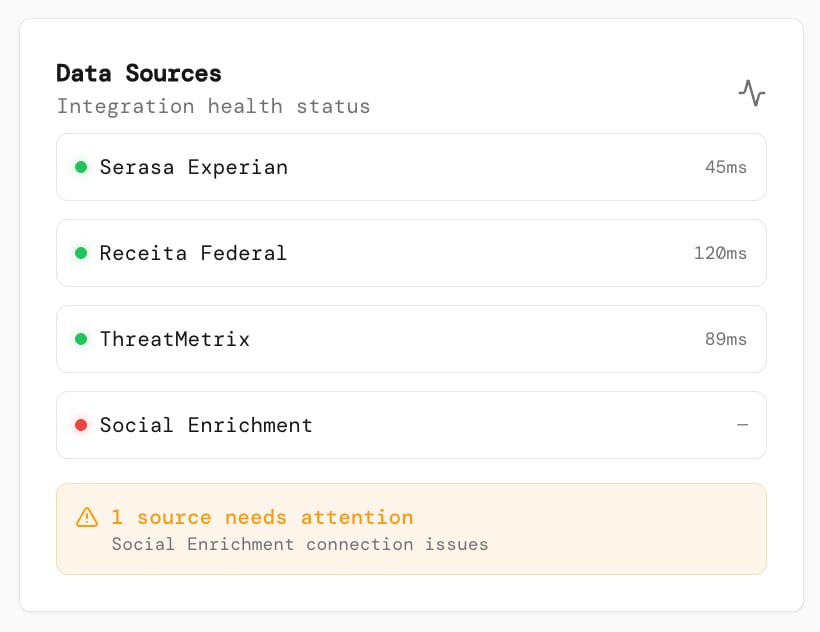
Each connected provider shows a status dot and latency. When a provider is degraded or disconnected, the panel adds a **needs attention** warning. The panel needs `datasources:read`; on the analyst template it stays empty. Analysts cannot change providers; tell an engineer.
## Data Sources health
Each connected provider shows a status dot and latency. When a provider is degraded or disconnected, the panel adds a **needs attention** warning. The panel needs `datasources:read`; on the analyst template it stays empty. Analysts cannot change providers; tell an engineer.
 ## Metric tiles
**Not available today.** The four tiles Pending Review, Approved Today, Declined Today and Avg. Decision Time, and the Detection Rate and False Positive Rate figures under Risk Distribution, show a dash: nothing populates them yet.
## Metric tiles
**Not available today.** The four tiles Pending Review, Approved Today, Declined Today and Avg. Decision Time, and the Detection Rate and False Positive Rate figures under Risk Distribution, show a dash: nothing populates them yet.